About
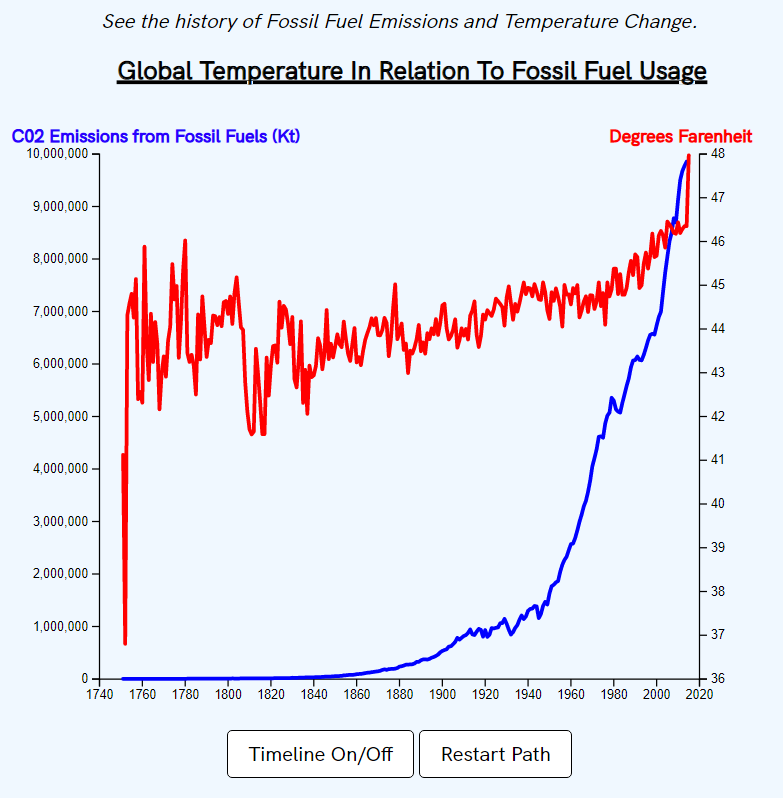
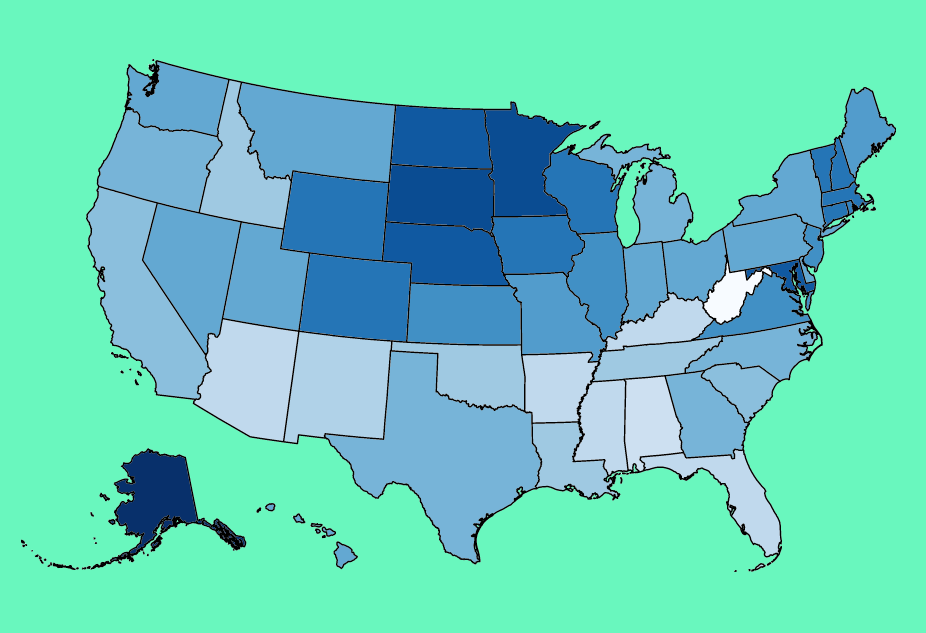
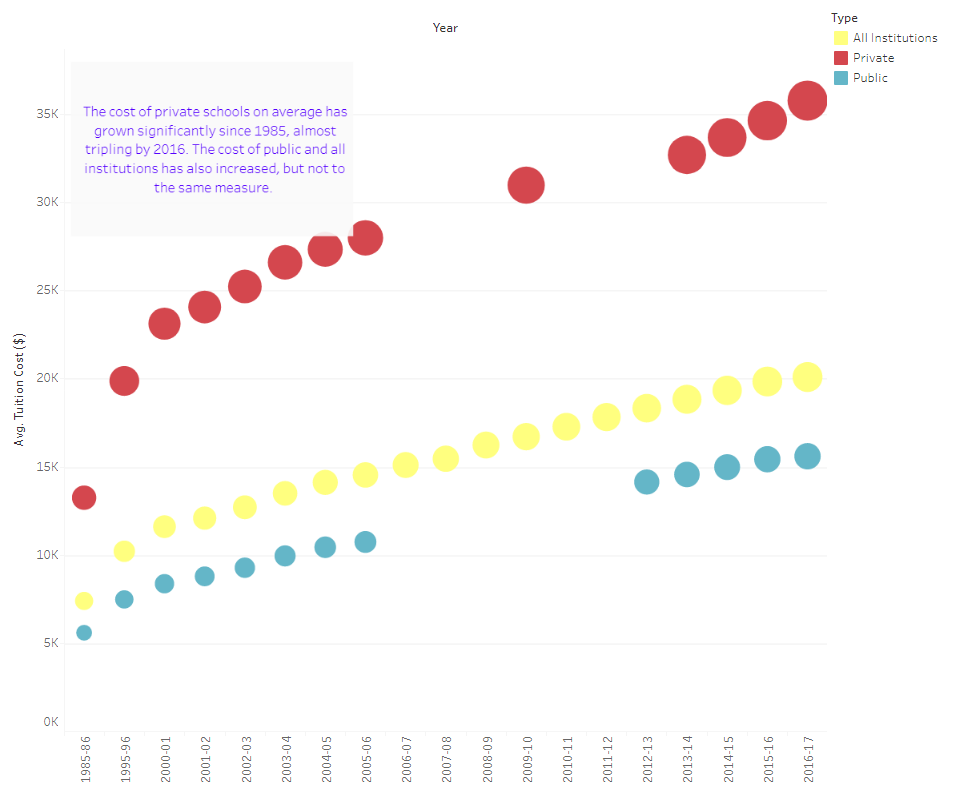
During my senior year, I took a Data Visualization class where we used mainly JavaScript (specifically the library D3), and some Tableau and Vega-Lite to not just visually represent data, but to tell stories through different types of visualizations and through interactions with the user. Click around to see some of the work I accomplished through the semester!